How to show the highest and lowest points on a Sparkline


Once you’ve applied a sparkline, you can then customise it. For example, you can get the Sparkline to show you where the highest and lowest points are. 

To apply these customisations, click on your sparkline and go to the Sparkline Tools tab. Go to the Show tab and tick the High Point and Low Point boxes.


This content is aimed at the Advanced level.   Click here to view our course overview.

How to add high first and last points to your sparkline


If you have a Sparkline in your spreadsheet, why not make it easier to view by adding first and last points to it. To apply the first and last points, select your sparkline and then go to the Sparkline Tools tab. On the Ribbon, tick the first and last point boxes. 


This content is aimed at the Advanced level.   Click here to view our course overview.

How to add negative points to your Sparkline


Once you’ve applied a sparkline, you can then customise it. For example, you can get the Sparkline to show you where the negative points are. 

To apply negative points, click on your sparkline and go to the Sparkline Tools tab. On the Ribbon tick the Negative Point box.


This content is aimed at the Intermediate level.   Click here to view our course overview.

How do I add textboxes to my Excel chart?


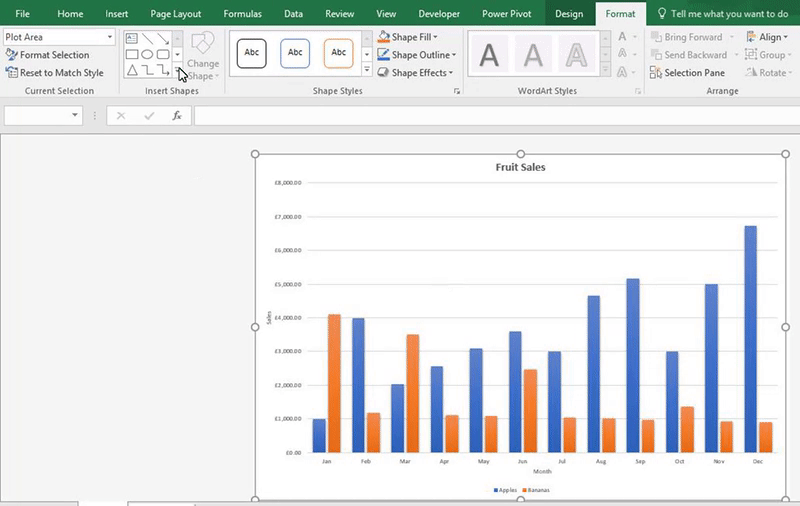
You can add textboxes to a chart. One use for textboxes on your chart is to add extra information 

If you want to add a text box to your chart, go to Chart Tools > Format > Insert Shapes and select the textbox icon, draw your textbox onto your chart and then type in the information.

If you’re not happy with where your textbox is located, then move it around to your desired location.


This content is aimed at the Intermediate level.   Click here to view our course overview.

How do you apply a Sparkline to an excel spreadsheet?

You can use a Sparkline to show your data in a more visual way.


How to insert a Sparkline

1. Go to the Insert tab > Sparkline group and select one of the options.

2. Select the data to be shown in your Sparkline

3. Select a cell location for your cell. Click OK.


This content is aimed at the Advanced level.   Click here to view our course overview.